RNA can change quickly, so measuring it requires careful handling from the start. rt quantitative pcr combines reverse transcription with real-time PCR to estimate specific RNA targets. First, an enzyme converts RNA into complementary DNA, or cDNA. Then, primers guide amplification of the selected sequence while fluorescent signals track newly made DNA across cycles. The signal is measured as the reaction proceeds—not only at the end.
That timing matters. A sample with more starting target often reaches a chosen fluorescence threshold in fewer cycles. Researchers commonly report this value as Cq or Ct, then interpret it using suitable standards or reference genes. It is not a direct molecule count by itself. Small differences in RNA quality, sample preparation, primer performance, or reaction conditions can shift the result. Details matter.
RT-qPCR can be performed as a one-step reaction, where reverse transcription and amplification occur in the same tube, or as a two-step workflow, where cDNA is prepared separately. Each approach has practical trade-offs. A sound experiment includes controls, replicates, and a clearly defined analysis method; no single control fixes every problem. Even familiar assays can mislead when normalization is weak or samples differ in quality. That deserves a second look. This guide explains the core steps, the role of fluorescence, and how results are interpreted, while noting where careful validation is essential.
RT-qPCR measures RNA by converting it into complementary DNA, or cDNA, before amplification. Reverse transcriptase performs this conversion in a prepared reaction tube. The instrument then repeats heating and cooling steps, often for 25–40 amplification cycles. During each cycle, DNA strands separate, primers bind, and a polymerase copies the target. Fluorescent signal rises as copies accumulate. Small details matter. Poor RNA quality or unsuitable primers can distort the result.
The cycle at which fluorescence crosses a set threshold is called Cq or Ct. A lower value generally indicates more starting target, but only when the assay is properly validated. The MIQE guidelines published in Clinical Chemistry recommend reporting key details, including RNA quality, controls, primer information, and amplification efficiency. A commonly used efficiency range is 90–110%. ISO 20395:2019 also outlines requirements for quantitative PCR methods. Even careful runs can disappoint. A clean curve alone cannot rule out contamination or a weak control; checking no-template and no-reverse-transcriptase controls helps reveal those problems.
RT quantitative PCR measures RNA by converting it into complementary DNA, then amplifying that DNA. Reverse transcriptase drives the first core reaction. It uses an RNA template and primers to build a stable cDNA copy. This step matters because RNA can degrade during collection, storage, or handling. A small delay on the bench may reduce the measured signal. Details matter.
DNA polymerase drives the second core reaction. The cDNA strands separate during heating, and primers attach to selected sequences. DNA polymerase then extends those primers with matching nucleotides. Each cycle can increase the target DNA rapidly. Fluorescent signals track this growth in real time. The cycle threshold, often called Cq or Ct, usually becomes lower when more target RNA is present. However, amplification efficiency affects that comparison. A Ct value is not a direct molecule count.
Reliable testing uses controls and careful interpretation. A no-template control can reveal contamination, while an RT-minus control can expose DNA carryover. Reference genes and technical replicates help assess sample quality. Inhibitors may create weak or irregular amplification curves. This is where judgment matters. I have seen protocols treat one Ct value as absolute truth, but that approach is too neat. Analysts should examine replicate variation, efficiency, and sample history before accepting an unexpected result. Perfect-looking data can still reflect imperfect preparation.
RT quantitative PCR, or RT-qPCR, measures RNA by converting it into complementary DNA and tracking its amplification. Fluorescence makes that tracking visible. In each reaction tube, a fluorescent dye or sequence-specific probe produces a signal linked to the amount of amplified DNA. The instrument records the signal after every cycle, while the sample remains in the machine.
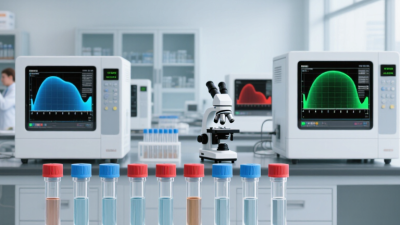
At first, fluorescence may sit close to the background. As amplification proceeds, the signal rises above a set threshold. The cycle at which this happens is used to estimate how much target RNA was present: samples with more starting material generally cross earlier, under comparable conditions. A curve on the screen can look simple. The interpretation is not always simple. Background noise, reaction efficiency, and sample quality can shift the result, so fluorescence alone does not prove a biological conclusion.
Reliable measurements depend on controls and consistent preparation. A no-template control helps reveal contamination, while a reference target can help account for differences between samples. The instrument’s curve is useful, but it is not a verdict. Even a neat curve deserves a second look. Fluorescence reports amplification, not the full story of the sample.
| Stage or concept | What happens | Fluorescence or measurement | Key interpretation or consideration |
|---|---|---|---|
| Starting material | RNA is isolated from a sample. For gene-expression analysis, the RNA may include messenger RNA and other RNA species, depending on the extraction and assay. | No target-amplification signal is measured at this preparation step. | RNA quality, quantity, and freedom from inhibitors can affect the result. |
| Reverse transcription (RT) | Reverse transcriptase copies RNA into complementary DNA (cDNA), which can serve as the template for PCR. | The RT step creates the DNA template; fluorescence-based target tracking occurs during the subsequent PCR cycles. | A no-reverse-transcriptase control can help detect signal arising from contaminating genomic DNA. |
| PCR denaturation | Heating separates double-stranded DNA templates into single strands. | The instrument records fluorescence at defined points in the cycling program; signal depends on the assay chemistry. | Temperature and duration are set for the specific enzyme, reagents, and assay. |
| Primer annealing and extension | Primers bind to complementary target sequences, and DNA polymerase extends them to make new DNA copies. | Repeated cycles generate more target DNA. Under ideal conditions, a target could double per cycle, but real reactions are not perfectly efficient. | Primer design and reaction conditions influence specificity and amplification efficiency. |
| Fluorescence detection | The instrument measures emitted fluorescence during PCR, using either a DNA-binding fluorescent dye or a sequence-specific fluorescent probe. | With a DNA-binding dye, signal generally rises as double-stranded DNA accumulates. With a probe-based assay, signal is generated when the target-specific probe is cleaved during extension. | Dye-based assays can detect any double-stranded product; probe-based assays add target-sequence specificity. |
| Amplification curve | Fluorescence readings across cycles form an amplification curve, typically progressing from baseline through an exponential phase and then toward a plateau. | The cycle threshold (Ct), also called the quantification cycle (Cq), is the cycle at which the signal crosses a defined threshold above baseline. | Within a validated assay, a lower Ct/Cq generally indicates more starting target than a higher Ct/Cq. |
| Quantification | Results can be estimated using a standard curve or compared between samples using a validated relative-quantification method. | A standard curve relates Ct/Cq values to known template amounts. Relative analysis commonly compares target and reference measurements across conditions. | Reference genes should be validated for stability in the sample set; efficiency and controls matter for reliable comparisons. |
| Quality controls | Common controls include a no-template control, positive control, and—when appropriate—a no-reverse-transcriptase control. | Controls are evaluated for expected amplification or absence of amplification, according to the assay design. | A no-template control helps identify contamination; a positive control helps confirm that the reaction can detect the target. |
| Typical uses | RT-qPCR is used to measure RNA-derived targets, including transcript abundance and RNA from pathogens, when the assay has been appropriately designed and validated. | Fluorescence allows the instrument to monitor amplification cycle by cycle without opening the reaction vessel after PCR. | The method detects and quantifies selected targets; it does not, by itself, identify every RNA sequence in a sample. |
In RT quantitative PCR, a standard curve checks how efficiently an assay measures known amounts of template. Prepare a serial dilution, run each level in replicate, and plot the cycle threshold (Ct) against the logarithm of the starting quantity. The points should form a roughly straight line. A slope near −3.32 corresponds to about 100% amplification efficiency: the target nearly doubles each cycle.
Efficiency is commonly considered acceptable between 90% and 110%. This range corresponds roughly to slopes from −3.58 to −3.10. Calculate efficiency using the slope: 10^(−1/slope) − 1 × 100. Check the dilution steps and pipetting carefully; a small transfer error can bend the curve. Replicate Ct values that spread widely also deserve attention. Small details matter.
A high R² can indicate that the dilution points fit a line, but it cannot prove that the assay is specific or that reverse transcription was consistent. Look at the curve, the replicates, and the controls together. If efficiency falls outside the expected range, consider template quality, inhibitors, primer design, or dilution accuracy before interpreting expression differences. One imperfect run is not a diagnosis. It is a reason to investigate.
What Is RT Quantitative PCR and How Does It Work?
RT quantitative PCR measures RNA after reverse transcription into complementary DNA. The ΔΔCq method then estimates relative expression against reference genes. It compares two differences: the target gene’s Cq minus the reference gene’s Cq, followed by treated samples versus controls.
The calculation is simple: ΔΔCq = ΔCq sample − ΔCq control. Relative expression is commonly reported as 2−ΔΔCq, assuming near-perfect amplification efficiency. A value of 2 suggests a two-fold increase, while 0.5 suggests a two-fold decrease. Small Cq shifts matter. One cycle can represent roughly a two-fold difference under ideal conditions.
Reference genes need stable expression.
The MIQE guidelines published in Clinical Chemistry emphasize reporting primer information, efficiency, controls, and sample quality. ISO 20395:2019 also stresses validated analytical performance, including precision and amplification efficiency. These standards show why a single reference gene may be insufficient. Its expression can change with tissue type, treatment, or stress.
In practical work, researchers often test several candidate reference genes before ΔΔCq analysis. Technical replicates can reveal pipetting variation, while no-template controls help identify contamination. Still, the method has limits. A neat fold-change may hide poor RNA integrity or unstable normalization. This is where interpretation becomes less certain. Results should be checked against biological replicates and independent evidence, not treated as absolute molecular truth.
Illustrative results for a target gene normalized to a reference gene. Expression is calculated as 2−ΔΔCq, with the control condition set to 1.
Lower or higher bars indicate relative expression compared with the control. The values shown are illustrative; reliable analysis requires validated reference genes and suitable biological replicates.
Visit the official SA government portal www.sacoronavirus.co.za to stay informed about latest COVID-19 updates. Dismiss