What Is the Difference Between PCR and qPCR?
PCR and qPCR are closely related laboratory methods, yet they answer different questions. PCR mainly reveals whether a target DNA sequence was amplified. qPCR also measures amplification during each cycle, using fluorescence to estimate the starting amount. In practical terms, PCR can produce a visible band on a gel. qPCR produces a cycle threshold value, commonly called Ct or Cq. The difference matters when researchers compare viral loads, gene expression, or diagnostic samples.
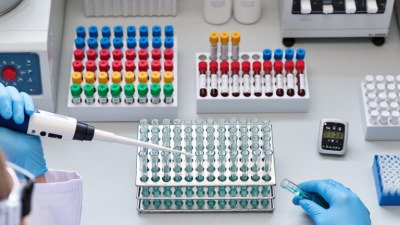
The “pcr e qpcr” distinction becomes clearer at the laboratory bench. A conventional PCR tube may show a final endpoint after amplification. A qPCR instrument records fluorescent signals as the reaction proceeds. According to the National Center for Biotechnology Information, real-time PCR supports quantitative analysis through fluorescence monitoring and calibration methods. The World Health Organization’s Laboratory Biosafety Manual also emphasizes validated procedures, controls, and careful interpretation of molecular results. These details are not minor. A contaminated control can create a convincing but unreliable result.
Industry reports reflect the expanding importance of both technologies. Grand View Research’s 2024 PCR market analysis links market growth with infectious-disease testing, genetic research, and personalized medicine. Thermo Fisher Scientific’s technical guidance highlights primer design, amplification efficiency, and reference controls as central qPCR considerations. Still, market growth does not guarantee good science. A large instrument can produce weak conclusions. Sample quality, assay specificity, standard curves, and reporting thresholds remain decisive. The difference may seem simple at first glance. It is not always. Understanding endpoint detection, real-time measurement, and experimental purpose helps readers choose the right method with greater confidence.
PCR and qPCR: Core Definitions and Shared Principles
PCR and qPCR: Core Definitions and Shared Principles
PCR, or polymerase chain reaction, copies a selected DNA region through repeated temperature cycles. Each cycle includes denaturation, primer binding, and extension. Heat separates the DNA strands, while short primers mark the target boundaries. A heat-stable polymerase then builds new strands. After many cycles, the target becomes visible through an endpoint method, such as gel analysis.
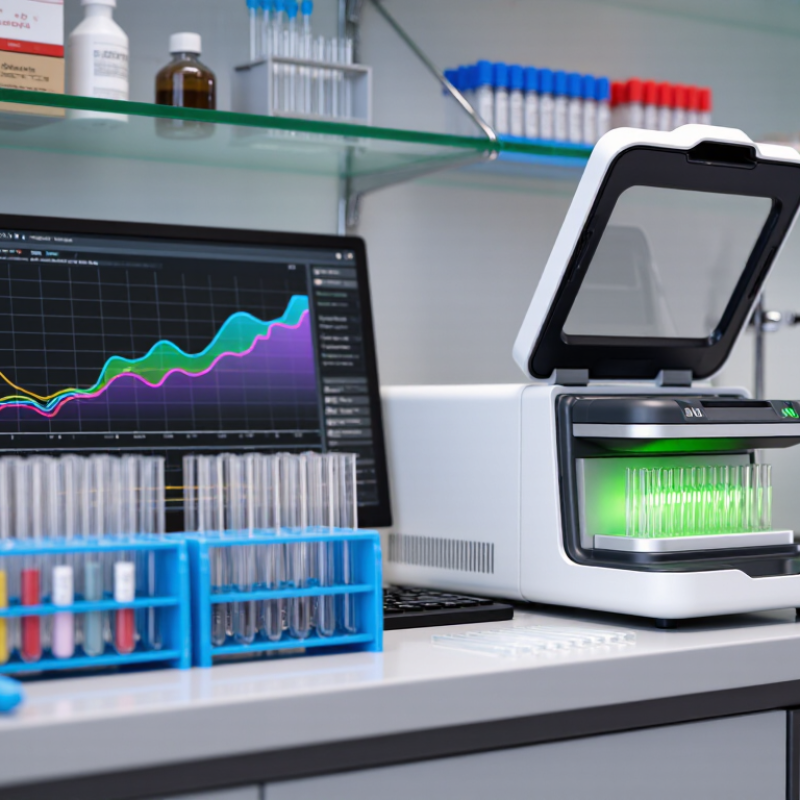
qPCR follows the same biological logic, but it measures amplification during every cycle. Fluorescent signals rise as the target DNA increases. The cycle threshold can help estimate the starting amount of template. This makes qPCR useful for comparing gene expression, detecting pathogens, or measuring DNA quantity. The difference sounds simple, but experimental reality is less tidy. Poor primer design, inhibitors, or uneven pipetting can distort results in either method. A bright signal is not automatically reliable evidence.
Tips: Keep reaction volumes consistent and include suitable controls. Check amplification curves, not only final values. A no-template control can reveal contamination, while a reference sample supports fair comparisons. Replicates matter. Even careful work can show unexpected variation. Repeating the test may be wiser than forcing a clean-looking conclusion.
How Conventional PCR Amplifies and Detects DNA
What Is the Difference Between PCR and qPCR?
How Conventional PCR Amplifies and Detects DNA
Conventional PCR copies a selected DNA region through repeated temperature changes. During denaturation, heat separates the two DNA strands. Primers then attach during annealing, and a polymerase extends them during the next step. Each cycle can theoretically double the target. The National Human Genome Research Institute explains that 30 cycles may produce over one billion copies from one starting molecule. That number is theoretical. Real reactions lose efficiency as primers, nucleotides, and enzymes become limited.
PCR is not magic.
After amplification, conventional PCR usually detects DNA at the endpoint. A laboratory separates products by gel electrophoresis, where DNA appears as visible bands. A strong band suggests more amplified material, but it does not provide a dependable starting quantity. Small differences in pipetting, contamination, or cycle efficiency can change the result. In my experience, a clean gel can still support a weak conclusion when controls are poorly designed. The Minimum Information for Publication of Quantitative Real-Time PCR Experiments guidelines emphasize reporting controls, primer details, efficiency, and replicate results. These practices improve reliability.
qPCR adds fluorescence monitoring during every cycle. It estimates DNA earlier, while conventional PCR checks the accumulated product afterward. However, qPCR is not automatically accurate. Calibration, inhibition testing, and technical replicates still matter. The practical difference is timing: conventional PCR amplifies first and detects later.
What Is the Difference Between PCR and qPCR?
Conventional PCR amplifies DNA and usually detects the final product after cycling. qPCR also amplifies DNA, but measures fluorescence during each cycle, enabling real-time monitoring and quantitative analysis.
The cycle counts shown are representative values commonly used in laboratory protocols: conventional PCR often uses approximately 25–35 cycles, while qPCR commonly uses up to about 40 cycles. Actual conditions depend on the assay, template, primers, and instrument. qPCR reports a quantification cycle (Cq/Ct) when fluorescence crosses a defined threshold; conventional PCR generally provides endpoint detection rather than a cycle-by-cycle measurement.
How qPCR Measures DNA During Each Amplification Cycle
What Is the Difference Between PCR and qPCR?
PCR and qPCR use repeated temperature cycles to copy specific DNA sequences. Traditional PCR usually measures the final product after amplification ends. It often relies on gel electrophoresis and visible bands. qPCR measures DNA during every amplification cycle. This timing creates a more detailed picture of the reaction.
At the end of each qPCR cycle, fluorescent signals are recorded. The signal usually rises as more target DNA accumulates. A computer compares this signal with a defined threshold. The cycle number crossing that threshold is called the Cq value, or Ct in some laboratories. Lower values generally indicate more starting DNA. Small differences matter.
The measurement depends on careful preparation. Primers must match the target, and the reaction needs suitable controls. A standard curve can estimate starting quantities across known concentrations. Amplification efficiency also affects the result.
In practice, poor pipetting, inhibitors, or uneven sample quality can distort the curve. I have found that a neat graph can still hide weak experimental design. qPCR is quantitative, but it is not automatically accurate.
Replicates, controls, and melting-curve checks help reveal problems. Threshold settings may also change the reported value, so they should be applied consistently.
Choosing Between PCR and qPCR for Different Laboratory Applications
PCR and qPCR answer different laboratory questions. Conventional PCR amplifies a target and usually confirms it at the endpoint. It suits presence-or-absence testing, cloning checks, and simple genotyping. Results often appear as bands on an electrophoresis gel. The method is practical and relatively affordable.
qPCR measures amplification during each cycle through fluorescence. It provides quantitative data, such as gene-expression levels or pathogen load. This makes qPCR valuable when sample concentration matters. The World Health Organization reported 7.5 million people newly diagnosed with tuberculosis in 2022. Molecular testing supports faster case detection, although laboratory quality still affects reliability. The MIQE guidelines also stress controls, calibration, reference genes, and transparent reporting. A number alone is not proof.
Tips: Choose PCR when you only need a clear yes-or-no result. Choose qPCR when you need concentration, fold change, or dynamic monitoring. Include positive, negative, and inhibition controls. For qPCR, validate primer efficiency before comparing samples. Poor sampling can defeat excellent chemistry. Do not treat a low signal as automatically meaningful. I have seen workflows become complicated without producing better decisions. Cost, equipment, technician training, and turnaround time should guide the choice. qPCR is not always the superior option. The best method depends on the question, sample type, and acceptable uncertainty.