Choosing between PCR and qPCR in 2026 starts with a practical question: do you need to detect a target, or measure how much is present? Conventional PCR amplifies DNA for endpoint analysis, often using gel bands to show whether a target was detected. qPCR tracks amplification during each cycle, producing data that can estimate starting quantities when the assay is properly designed and validated. The distinction matters at the bench. A visible band may answer a presence-or-absence question; a changing fluorescence curve can help compare samples. Neither method rescues poor controls or unsuitable primers.
Molecular biologist Stephen A. Bustin and coauthors wrote in the MIQE guidelines, “The reliability of results generated by quantitative real-time PCR (qPCR) depends on the quality of the experimental design, the reagents and protocols used, and the analysis of the data.” That guidance remains useful when evaluating pcr y qpcr workflows. This article compares their applications, equipment needs, costs, controls, and common limitations, then offers a decision framework for routine testing and research. A qPCR instrument can save time, but it also adds expense and analysis steps. Standard PCR may be enough for a clear, qualitative result. Sometimes, though, a gel that looks convincing is not the whole story. Your sample type, required sensitivity, and need for quantitative data should guide the choice—not the newer technology alone.
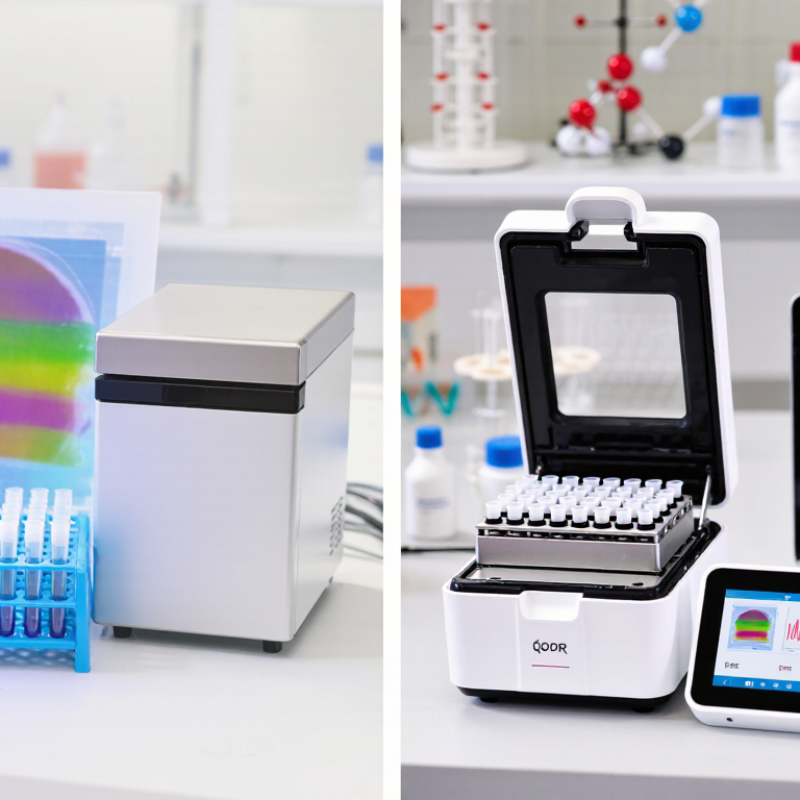
PCR and qPCR answer different questions about genetic material. Conventional PCR copies a selected DNA region through repeated heating and cooling cycles. The result is usually checked at the end, often as bands on a gel. A visible band can show that the target was amplified, but its brightness is not a dependable measure of the original amount. PCR is useful when the main question is whether a target sequence is present. For RNA targets, the RNA must first be converted into complementary DNA.
qPCR tracks amplification as it happens, using fluorescence measured during each cycle. The cycle threshold, often called Cq or Ct, indicates when the signal rises above background. Lower values generally suggest more starting target, provided the assay performs well. Absolute estimates need suitable standards; relative comparisons need stable reference genes and consistent conditions. Small shifts matter. A weak control or uneven sample quality can distort the apparent difference, so a number alone is not the whole story.
Tips: Match the method to the question. Choose PCR for a clear presence-or-absence check; consider qPCR when you need to compare or estimate target amounts. Include positive and negative controls, and verify RNA-derived results with reverse-transcription controls. One point deserves a second look: qPCR can appear precise while still reflecting poor sample handling or an unsuitable assay. Check the controls before interpreting the curve.
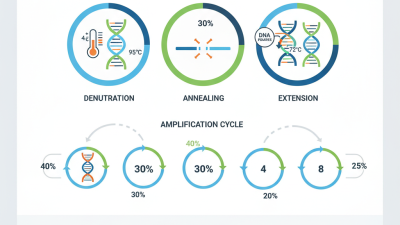
PCR and qPCR share the same basic cycle: denaturation, primer binding, and DNA extension. The difference becomes clear at the bench. With conventional PCR, you usually wait until amplification ends, then inspect the product on a gel. It is an endpoint readout. With qPCR, fluorescence is measured during each cycle, so amplification can be tracked as it happens. No gel is usually needed.
The results answer different questions. A PCR band can show whether a target was detected and whether its product appears to be the expected size. It does not reliably tell you how much starting DNA was present. qPCR estimates starting quantity from the cycle at which fluorescence crosses a set threshold. Earlier signals generally indicate more starting target. But that estimate depends on sound controls, suitable primers, and efficient amplification. Small setup errors matter.
Choose PCR when a clear presence-or-absence result is enough, or when you need to check product size. Choose qPCR when comparing target amounts across samples or monitoring changes over time. It requires careful assay setup and interpretation. That sounds tidy, but real samples can be less cooperative. Inhibition, poor sample quality, or inconsistent controls may confuse either method. A late qPCR signal is not automatically meaningful; review the controls and validation data before drawing conclusions.
Choose the question. If you only need to confirm that a target sequence is present, conventional PCR may be enough. It produces an endpoint result, often read as a band on a gel. For a small screening project, that can mean simpler analysis and lower reagent costs. But it will not reliably tell you how much starting material was present.
Choose qPCR when your question depends on quantity, change, or a threshold. It tracks fluorescence during amplification, helping compare gene expression or estimate pathogen load. The WHO Global Tuberculosis Report 2023 recorded 7.5 million people newly diagnosed with tuberculosis in 2022, illustrating the scale at which dependable molecular testing can matter. That figure is not a direct comparison of PCR methods; it is a reminder to match assay design to the decision your results must support.
Before choosing, consider sample quality, controls, instrument access, and how precise your comparison needs to be. The MIQE guidelines by Bustin and colleagues emphasize transparent reporting of qPCR methods and controls. A low cycle-threshold difference can look meaningful, yet poor normalization may distort it. More data is not automatically better. If your study only needs a yes-or-no answer, qPCR may add cost and complexity without improving the decision. Conversely, endpoint PCR can miss useful quantitative changes. I would check the research question again before committing.
Compare the typical capabilities of endpoint PCR and real-time quantitative PCR (qPCR).
Choose endpoint PCR when you need to detect an amplification product, often after the reaction is complete. Choose qPCR when you need to monitor amplification in real time or estimate starting nucleic-acid quantity; reliable quantification requires appropriate assay validation and calibration. The chart shows typical workflow capabilities, not a performance rating.
Sample type can matter more than the instrument. Conventional PCR shows whether a target was amplified, usually through a gel. qPCR tracks amplification as it happens and can estimate target quantity. For a clean, well-characterized sample, either method may work. But extracts containing inhibitors, such as some soil or food samples, can produce unreliable results with both. Include extraction and inhibition controls; a fluorescent curve alone does not prove the sample was suitable.
Throughput and budget change the calculation. A lab testing a few samples may find conventional PCR and gel checks more economical, though hands-on work adds time. qPCR can process many reactions in a run and avoids post-amplification gel analysis, but instruments, reagents, and assay setup cost more. Not always. A busy lab may save staff time with qPCR, while a small project may not recover the extra expense. I would compare total cost per reportable sample, including repeat tests and labor, rather than instrument price alone.
Tips: Match the method to the question: presence or absence favors PCR; measured quantity favors qPCR. Pilot both on representative samples before committing. Record failed runs, too. Real sample performance can differ from a tidy validation plate.
Choosing between PCR and qPCR in 2026 starts with the result your work needs. Conventional PCR reveals whether a target amplified, often through a gel-based endpoint readout. qPCR measures fluorescence during cycling, helping estimate target quantity across samples. If you only need a clear presence-or-absence result, qPCR may add cost without improving the decision. That can be enough.
Consider sample volume, turnaround time, and staff experience. A busy diagnostic or research workflow may benefit from qPCR’s faster, closed-tube readout, which reduces post-amplification handling. It does not eliminate contamination risk. Include appropriate positive, negative, and internal controls, especially when samples contain inhibitors or vary in quality. For quantitative work, check assay efficiency and standard-curve performance; a number is not automatically reliable.
Budget beyond the instrument. Reagents, plastics, calibration, maintenance, and analysis software can shape the true cost per sample. Conventional PCR may fit a small lab with occasional testing and simple targets. qPCR makes more sense when comparing expression levels, tracking changes over time, or processing many samples consistently. I would still pilot the assay with real samples before committing. Clean reference material can make a method look better than it performs on a crowded workbench.
Visit the official SA government portal www.sacoronavirus.co.za to stay informed about latest COVID-19 updates. Dismiss